How to Read Your ECG Report

An ECG report is one of the few medical documents handed to you that is almost entirely self-explanatory once you know the conventions, and almost entirely opaque until you do. It is a graph. Time runs left to right, voltage runs up and down, and the squiggles are a recording of electricity crossing your heart.
This is written so you can follow your own report and have a better conversation about it. It is not a substitute for someone qualified reading it in the context of your symptoms and history, which is the part no diagram can do.
What is actually being recorded
Your heart contracts because an electrical signal sweeps across it in a set order. That signal is large enough to reach your skin, and the electrodes are picking it up from there.
Two things follow from this that explain most of what confuses people. The ECG shows electrical activity, not pumping, so a trace can look acceptable while the heart is pumping poorly. And the signal is measured from several angles at once, which is why one heartbeat appears a dozen times on the page.
The squares
Every ECG is printed on the same grid, and the whole thing is useless until you know what the squares are worth.
Paper runs at 25 mm per second, so horizontally, one small square is 0.04 seconds and one large square, five small ones, is 0.2 seconds. Vertically, the standard calibration is 10 mm per millivolt, so one small square is 0.1 mV.
Both numbers are printed or shown as a calibration pulse on the report itself, usually a small rectangular step at one edge. It is worth a glance, because if someone has halved the gain to fit a very tall trace on the page, every height on that ECG means twice what it looks like.
The bumps, one at a time
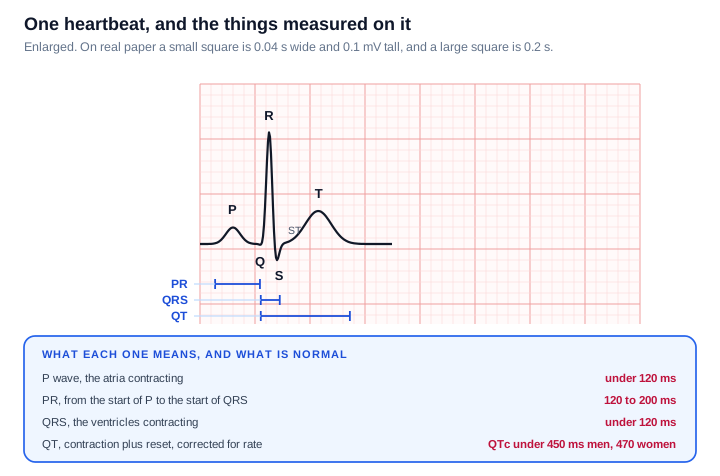
Each heartbeat produces the same sequence.
The P wave is the atria contracting. The QRS complex is the ventricles contracting, and it is sharp and tall because the ventricles are the big muscular chambers. The T wave is the ventricles resetting electrically so they can go again.
Between them sit the measurements that most abnormalities show up in. The PR interval is how long the signal takes to get from the atria to the ventricles. The QRS duration is how long the ventricles take to depolarise. The QT interval covers contraction plus reset, and because it naturally shortens as the heart speeds up, it gets corrected for rate and reported as QTc.
One thing that is not a wave at all but matters more than most: the ST segment, the stretch between the end of the QRS and the start of the T wave. It should sit level with the baseline. Deviation up or down from that line is one of the most consequential findings on an ECG.
Why the shape is that shape
The trace makes much more sense once you see it as a recording of a journey rather than a set of shapes to memorise.
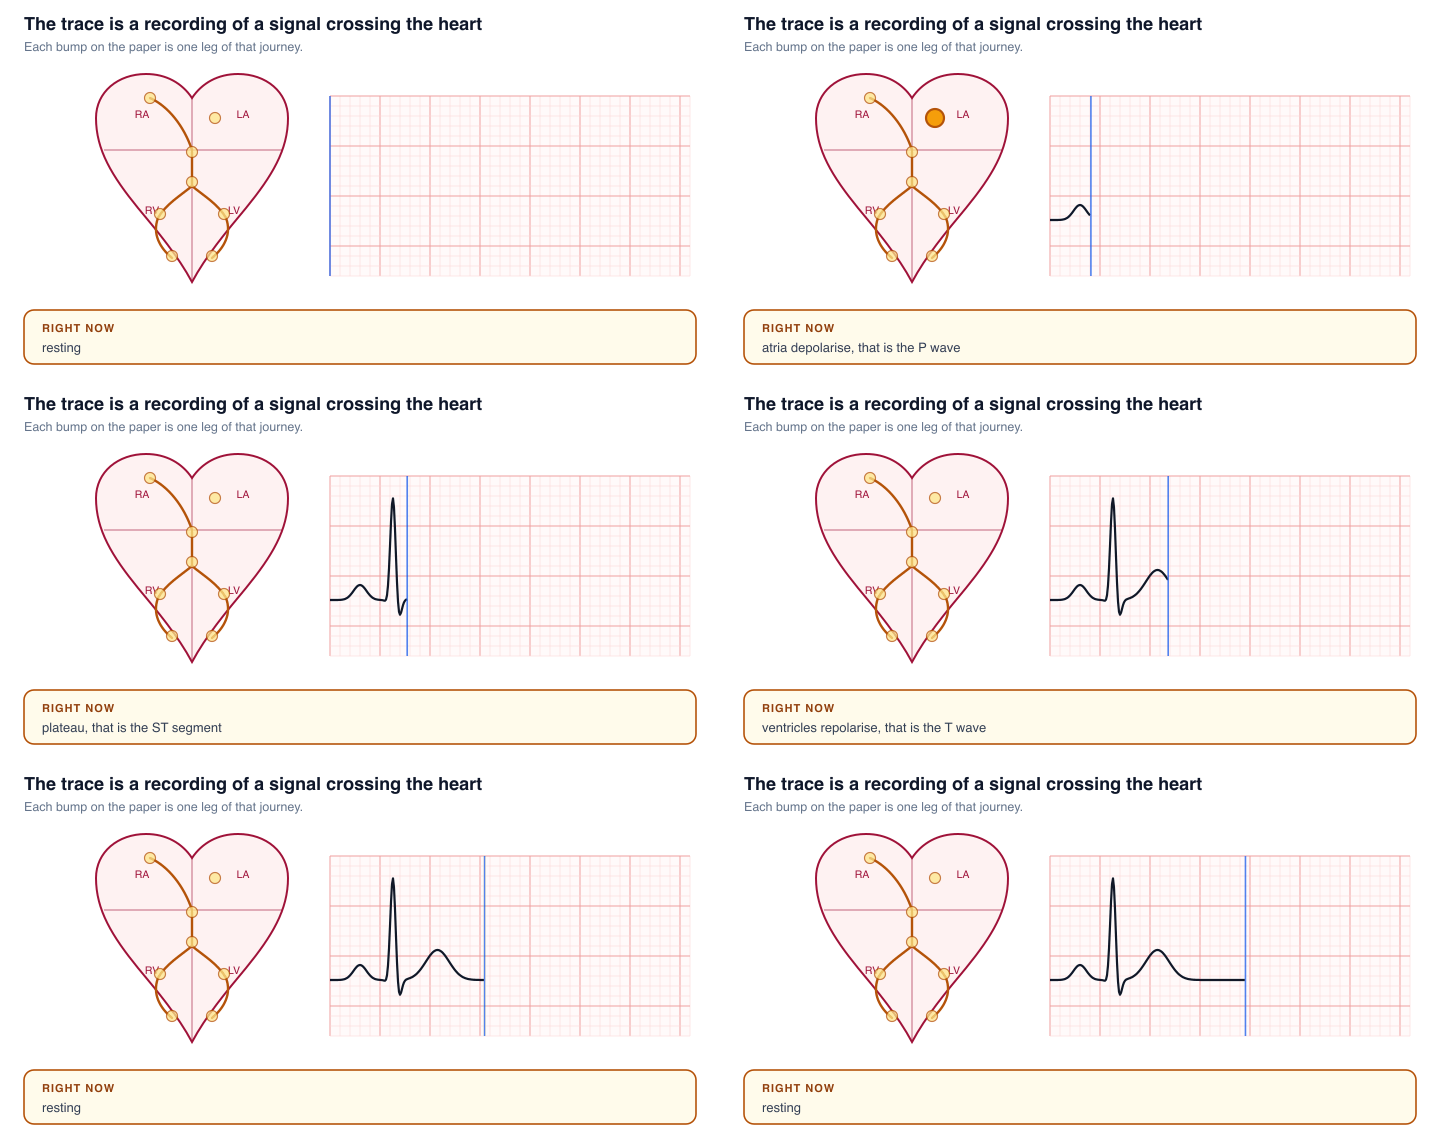
The signal starts at the SA node, the heart's own pacemaker, spreads across the atria and gives you the P wave. It then reaches the AV node, which deliberately holds it for a moment. That pause is the flat stretch after the P wave, and it exists so the atria can finish emptying into the ventricles before the ventricles contract.
From there it runs down the bundle of His, splits into the left and right bundle branches, and spreads through the ventricle walls via the Purkinje fibres. That is the QRS, and it is narrow precisely because this wiring is fast. A wide QRS means the signal took a slower route, which is what a bundle branch block is.
Why twelve leads
You have one heart. The twelve views come from combining the electrodes in different ways, each one looking at the heart from a different angle.
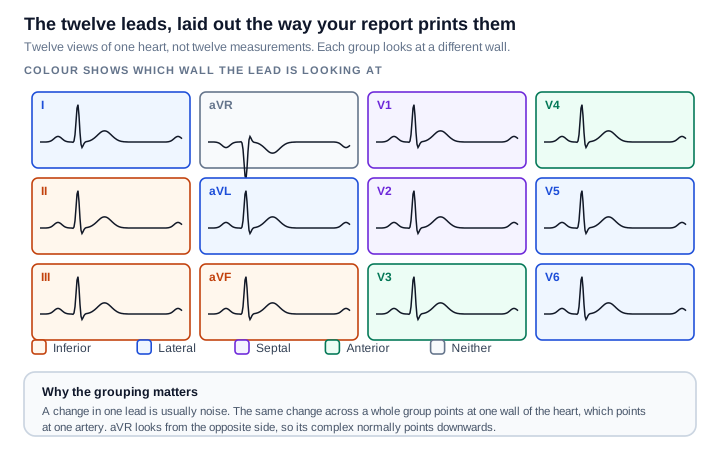
This grouping is the single most useful thing to know about the layout, because it turns twelve traces into four questions.
| Group | Leads | Looking at |
|---|---|---|
| Inferior | II, III, aVF | The bottom wall |
| Lateral | I, aVL, V5, V6 | The left side wall |
| Septal | V1, V2 | The wall between the ventricles |
| Anterior | V3, V4 | The front wall |
A change in a single lead is usually noise. The same change appearing across a whole group points at one region of heart muscle, which in turn points at one artery. That is why a report says something like "inferior" rather than naming leads.
aVR is the odd one out. It looks at the heart from the right shoulder, so it sees everything going away from it, and its complex normally points downwards. An upright aVR is a clue that the electrodes may have been put on wrong.
Reading it in five steps
Work through it in the same order every time, because consistency is what stops you anchoring on one dramatic-looking squiggle and missing something quieter.
1. Rate. If the rhythm is regular, count the large squares between two R waves and divide 300 by that number. Four large squares is 75 beats per minute, three is 100, five is 60. If it is irregular, count the beats in a six-second strip and multiply by ten. Normal is 60 to 100.
2. Rhythm. Are the gaps between beats equal? Is there one P wave before every QRS, and one QRS after every P? If yes to both, that is sinus rhythm, which is the normal pattern.
3. Intervals. PR between 120 and 200 ms, QRS under 120 ms, QTc under roughly 450 ms in men and 470 ms in women.
4. Axis. A rough check: if the main deflection is upwards in both lead I and lead aVF, the axis is normal. This one is reported for you, so it is mostly a sanity check.
5. The segments and waves themselves. Is the ST segment level with the baseline in every group? Are the T waves upright where they should be? Are the Q waves small?
A worked example
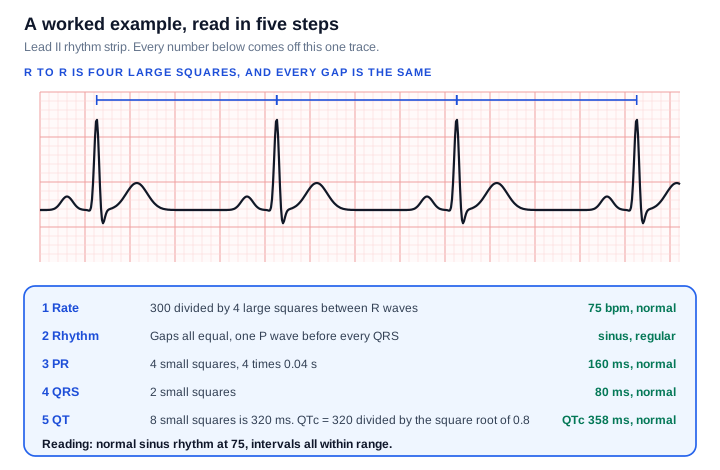
Taking that strip through the five steps:
Rate. The R waves are four large squares apart. 300 divided by 4 gives 75 beats per minute.
Rhythm. Every gap is the same, and there is one P wave before every QRS. Regular sinus rhythm.
PR. From the start of the P wave to the start of the QRS is four small squares. Four times 0.04 is 160 ms, comfortably inside 120 to 200.
QRS. Two small squares, so 80 ms, well under 120.
QT. Eight small squares is 320 ms. Correcting for rate using Bazett's formula, QT divided by the square root of the R-R interval in seconds, gives 320 divided by the square root of 0.8, which is 358 ms. Normal.
Reading: normal sinus rhythm at 75, all intervals within range.
Worth knowing about that correction: Bazett's formula is the one most machines use, and it over-corrects when the heart is fast and under-corrects when it is slow. At a rate near 60 it barely changes anything. At 130 it can make a normal QT look alarming, which is one reason a borderline QTc on a fast trace is usually worth a second opinion rather than a reaction.
Three patterns worth recognising
Irregularly irregular with no P waves. When the gaps between beats follow no pattern at all and you cannot find P waves anywhere, that is the usual appearance of atrial fibrillation. The giveaway is the complete absence of a pattern, rather than beats that are merely fast or slow.
ST segments that are not on the baseline. Elevation or depression across a contiguous group is what is being looked for in someone with chest pain. The group matters, which is what the colour coding above is for.
A PR interval that keeps stretching. A PR over 200 ms is first degree heart block, often harmless. Patterns where the PR lengthens beat by beat until one QRS is dropped, or where beats drop without warning, are the more significant forms.
About the machine's printed interpretation
Most reports carry a computer-generated reading at the top. Treat it as a first draft.
These algorithms are deliberately tuned to over-call rather than miss things, so they flag findings that turn out to be nothing far more often than they miss findings that matter. "Borderline" anything, "possible" anything, "early repolarisation" and "incomplete right bundle branch block" are all commonly printed on entirely normal ECGs, particularly in young and athletic people. They are also affected by electrode placement, movement and baseline wander.
This cuts both ways, which is the reason every ECG is still over-read by a clinician. The machine does not know you have been having chest pain for two days, and your previous ECG from three years ago is often the single most useful comparison available.
When not to be reading a diagram
Everything above is for understanding a report you already have, calmly, after the fact.
It is not for working out whether symptoms you are having right now are serious. Chest pain, pressure or tightness, breathlessness, fainting, or a racing heart that will not settle are all reasons to get medical help straight away rather than to start counting squares. An ECG can be completely normal during a genuine problem, and can look abnormal in someone perfectly healthy, which is precisely why it is read alongside everything else rather than on its own.
Sources and further reading
- PR and QT intervals, reference ranges
- QTc correction formulae, Bazett and Fridericia
- QTc upper limits of normal by sex
If you like this way of taking a thing apart, the same treatment applied elsewhere in the body: Which Part of the Brain Does What, and Cerebrospinal Fluid, Where It Comes From and Where It Goes.
Never miss a post
New guides on VMware Cloud Foundation, Aria Suite, and infrastructure automation. Follow the blog in your feed reader and new posts show up as soon as they are published.
Using a different reader? Copy the feed URL and add it there.